Diagram recipes
Copy a recipe, paste it into the editor, then change the words.
These recipes are for Mermaid Diagrams & Gantt for Confluence. Mermaid is a widely used way of writing diagrams as text; GitHub and GitLab use it too. Each recipe was checked in the app.
To use a recipe:
- Drag across the recipe's text, from the start of its first line to the end of its last, to select all of it. Then press Ctrl+C (Cmd+C on a Mac) to copy it. On this page, Ctrl+A selects the whole web page, not the recipe.
- Insert a Mermaid Diagram, or edit one. The editor opens.
- Click in Diagram source and select all its text (Ctrl+A, or Cmd+A on a Mac). Then paste the recipe with Ctrl+V (Cmd+V).
- Change the words. The preview redraws as you type.
- Select Save, at the foot of the editor. It stays in view while you scroll.
New to Mermaid? Get started in 5 minutes.
Every recipe has the same parts. It says when to use it and how to start. Then come the text, its picture, how to change it, what to watch out for, and a link to all the options.
On this page
Draw a process
For approvals, workflows and "what happens when". Start with the
Flowchart example, or type
flowchart TD on the first line.
flowchart TD
  submit([Expense submitted]) --> receipt{Receipt attached?}
  receipt -->|No| ask[Ask for the receipt]
  ask --> receipt
  receipt -->|Yes| amount{Over 500 EUR?}
  amount -->|No| pay[Pay out]
  amount -->|Yes| finance[Finance approves]
  finance --> pay
  pay --> done([Done])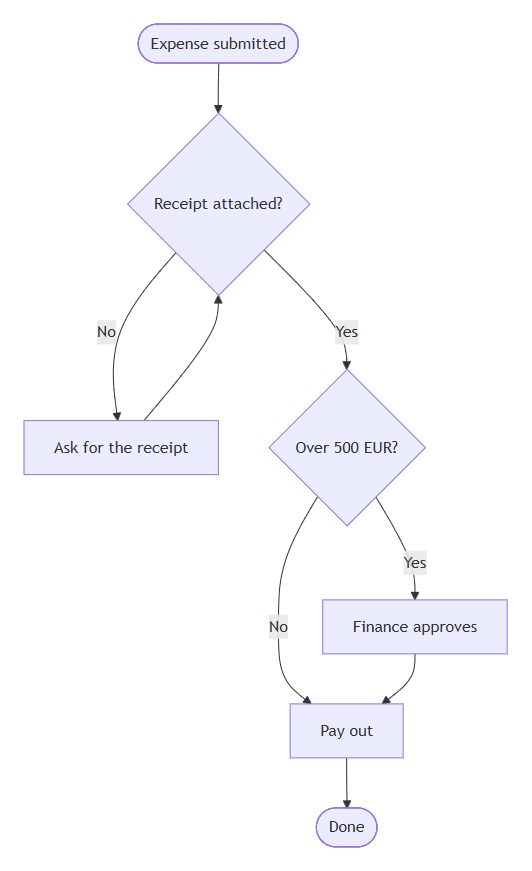
Change it
- Rename a box by changing the words in its brackets. Keep its short name.
-
Add a question with
{ }, and label its arrows with|Yes|and|No|. -
Point an arrow back to an earlier box to repeat a step, as
ask --> receiptdoes. - Change
TDtoLRto draw it from left to right.
Show who does each step
Put each team's steps between subgraph and
end. The words in square brackets after
subgraph name the group.
flowchart LR
  subgraph support [Support team]
    ticket[Ticket arrives] --> fix{Can we fix it?}
  end
  subgraph eng [Engineering]
    look[Investigate] --> release[Release a fix]
  end
  fix -->|No| look
  fix -->|Yes| reply[Reply to the customer]
  release --> reply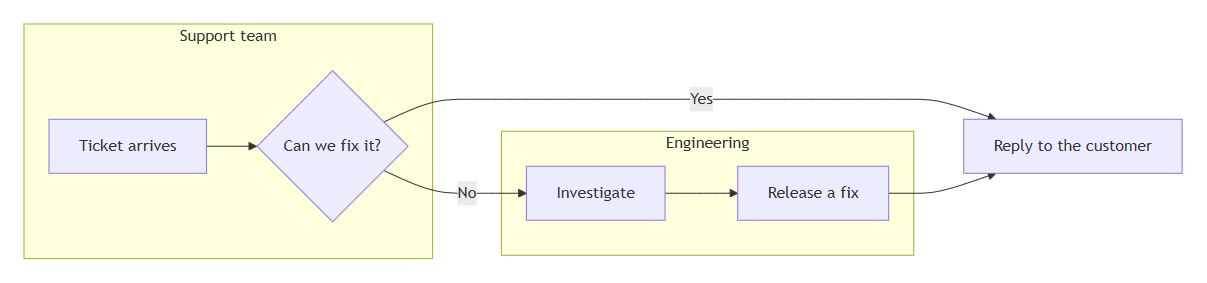
TD when there are more steps.Watch out
-
Do not name a box
end: Mermaid reads it as the end of a group. Usedone, as this recipe does. -
Put words with brackets or other symbols in double quotes:
A["Cost (EUR)"].
All options: shapes and arrows in the guide, and every flowchart option in the reference.
Plan a project timeline
A Gantt chart is a project plan drawn as bars on a calendar. Use it for a launch, an office move or any plan with dates. Start with the Gantt example.
gantt
  title Office move
  dateFormat YYYY-MM-DD
  axisFormat %d %b
  excludes weekends
  section Prepare
    Choose movers       :done, movers, 2026-10-01, 3d
    Pack team areas     :active, pack, after movers, 5d
  section Move
    Move furniture      :crit, move, after pack, 2d
    Set up desks and IT :it, after move, 3d
    Office opens        :milestone, open, after it, 0d
  section Afterwards
    Collect feedback    :feedback, after open, 5d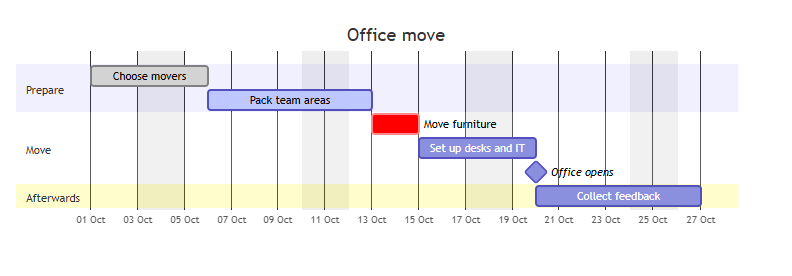
Tasks, dates and lengths
Each task is a name, a colon, then details separated by commas: a short id, a start and a length.
Choose movers :movers, 2026-10-01, 3d
dateFormat YYYY-MM-DD says how the dates are written.
Lengths are in days, such as 5d, or weeks, such as
2w. A lowercase m means minutes, not
months.
One task after another
A dependency is a task that has to wait for another one. Write
after and the other task's id instead of a start date.
after copy banner starts a task when the later of the
two ends. until and an id end a task when another one
starts.
gantt
  title Campaign page
  dateFormat YYYY-MM-DD
  axisFormat %d %b
  tickInterval 1day
  section Content
    Write copy    :copy, 2026-11-02, 4d
    Design banner :banner, 2026-11-02, 6d
  section Publish
    Publish page  :publish, after copy banner, 1d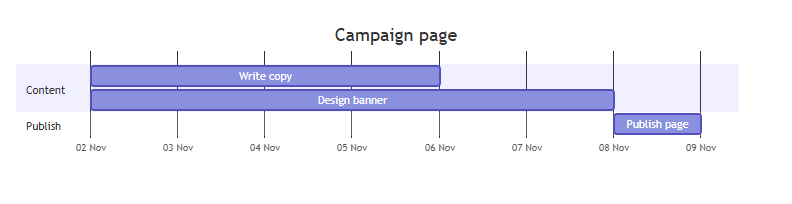
Milestones
A milestone is a single point in time, such as a launch day. Add
milestone and a length of 0d, and it is
drawn as a diamond.
Office opens :milestone, open, after it, 0dDone, in progress and critical
Put a tag before the id: done, active for
in progress, or crit for critical. Tags can be combined,
as in crit, active.
Move furniture :crit, move, after pack, 2dSections
section and a name start a group of tasks. The name
shows on the left of the chart.
Weekends and holidays
excludes weekends skips Saturdays and Sundays. Add
dates after it, separated by commas, to skip holidays too. A 5-day
task then ends later, because it skips those days.
gantt
  title December support rota
  dateFormat YYYY-MM-DD
  axisFormat %d %b
  excludes weekends, 2026-12-24, 2026-12-25, 2026-12-31
  todayMarker off
  section Cover
    Team A :teama, 2026-12-14, 5d
    Team B :teamb, after teama, 5d
    Team A :teama2, after teamb, 5d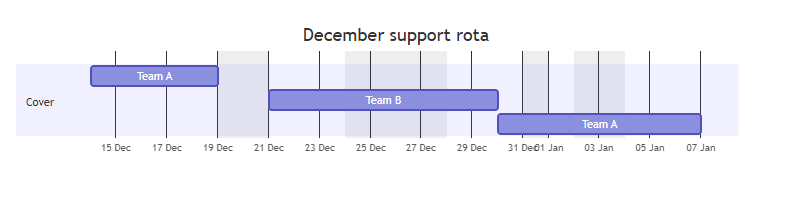
If your weekend is Friday and Saturday, add
weekend friday under excludes weekends.
The today line
A line marks today when today falls within the chart.
todayMarker off hides it, as in the rota above. You can
also change how it looks:
gantt
  title This quarter
  dateFormat YYYY-MM-DD
  axisFormat %d %b
  todayMarker stroke-width:3px,stroke:#1f9e7d
  section Work
    Current sprint :s1, 2026-09-21, 14d
    Next sprint    :s2, after s1, 14d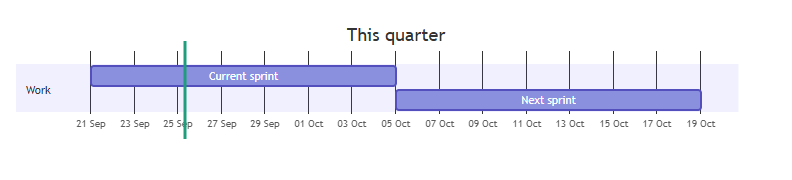
Dates along the top
axisFormat %d %b writes dates as 05 Oct. Without it,
the axis shows full dates, which can run into each other.
tickInterval 1week puts one date on each week.
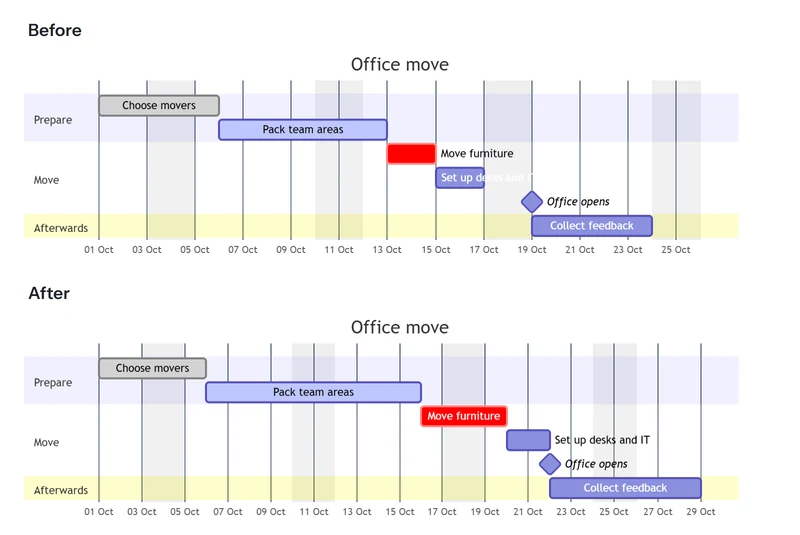
Change one task and the plan moves
Tasks that start with after follow the task they name.
Make one task longer, and every task that depends on it moves later.
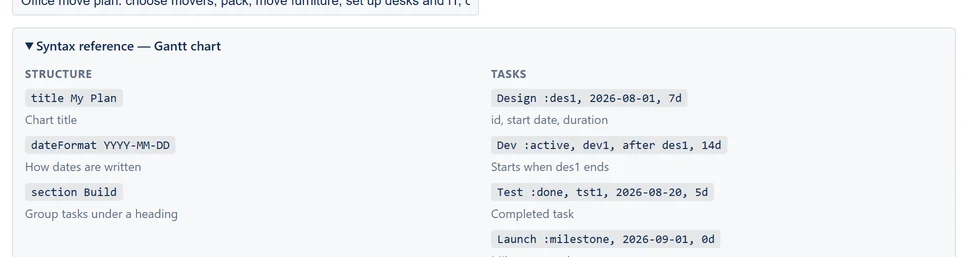
The editor's Syntax reference lists the Gantt patterns while you write one.
Watch out
- A colon ends a task's name, so don't use one inside a name.
- Give every task its own id.
- Write every date the way
dateFormatsays. - Keep
#and;out of the details after the colon. Either one causes an error.
All options: every Gantt option in the reference.
Show who talks to whom
For a support escalation, a hand-off between teams, or how two systems talk. A sequence diagram shows messages between people or systems, in order, from top to bottom. Start with the Sequence example.
sequenceDiagram
  actor Customer
  participant Desk as Service desk
  participant Eng as Engineering
  Customer->>Desk: Reports a problem
  Desk->>Desk: Checks known issues
  alt Known issue
    Desk-->>Customer: Sends the workaround
  else New issue
    Desk->>Eng: Raises a bug
    Eng-->>Desk: Fix released
    Desk-->>Customer: Confirms the fix
  end
  Note over Desk,Eng: Outages are escalated the same day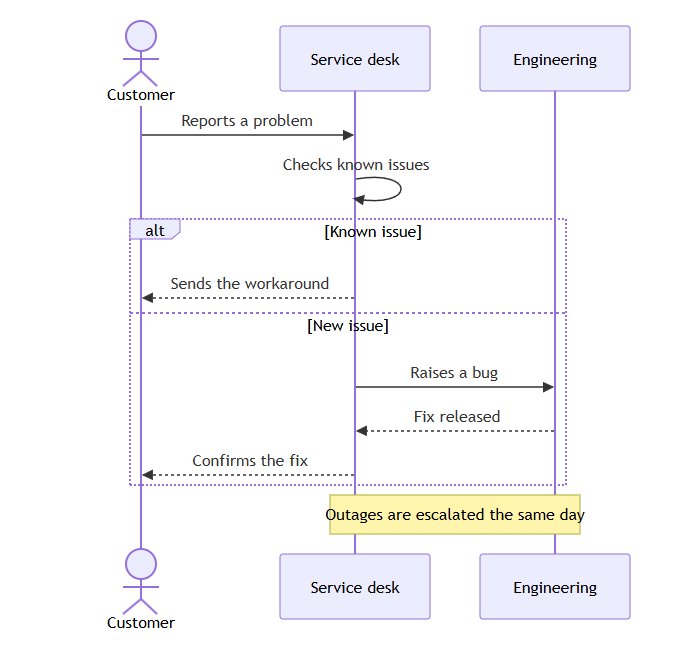
alt box holds the two paths: a known issue, or a new one.Change it
-
participant Desk as Service deskgives a short name a longer label. actordraws a person instead of a box.-
->>sends a message, and-->>replies. -
alt,elseandendshow "if this, else that". loop…endrepeats a group of messages.Note over A,B:adds a note across two people.
Watch out
Every alt or loop needs its own end.
All options: every sequence option in the reference.
Draw an org chart
For teams, and who reports to whom. Mermaid has no special org chart
type, so use a top-down flowchart: type flowchart TD on
the first line.
flowchart TD
  md[Managing director]
  ops["Head of operations<br>Oslo office"]
  sales["Head of sales<br>Bergen office"]
  md --> ops
  md --> sales
  ops --> support(Support)
  ops --> it(IT)
  sales --> accounts(Account managers)
  sales --> partners(Partners)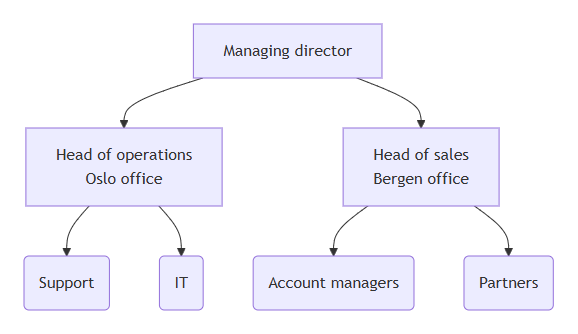
<br> puts each office on a second line in its box.Change it
- Write one line per reporting line:
md --> ops. -
<br>puts a title on a second line in the same box. - Use
( )for teams and[ ]for people. - Put a department between
subgraphandend.
Watch out
A wide chart gets small on the page. Split a large organisation into one diagram per department.
All options: flowchart shapes and arrows in the guide.
Map ideas
For brainstorms, meeting agendas and topic maps. Start with the Mind map example.
mindmap
  root((Product launch))
    Audience
      Existing customers
      New trials
    Channels
      Blog post
      Newsletter
      Webinar
    Risks
      Late features
      Support load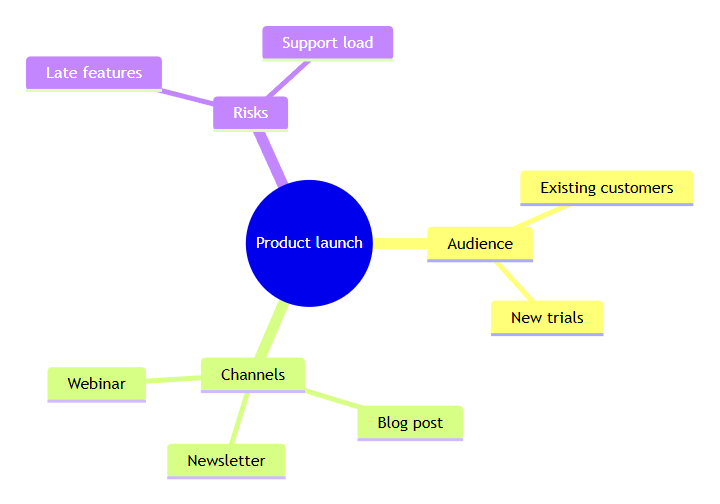
Change it
- Indent each level two spaces more than the one above.
- Press Tab to indent a line two spaces, and Shift+Tab to take them away. The space bar works too. Enter starts a new line at the same level as the one above. To leave the text with the keyboard, press Esc, then Tab.
root((…))is the idea in the centre.-
Brackets change an idea's shape:
id[Square]orid(Rounded).
Watch out
The indentation is the structure. One space too many or too few can move an idea to another level.
All options: every mind map option in the reference.
Document tables
For database tables, or spreadsheet tabs, and how they connect. An ERD (entity relationship diagram) shows tables as boxes and their links as lines. Start with the ERD example.
erDiagram
  CUSTOMER ||--o{ ORDER : places
  ORDER ||--|{ ORDER_LINE : contains
  PRODUCT ||--o{ ORDER_LINE : "appears on"
  CUSTOMER {
    string name
    string email
  }
  ORDER {
    int number PK
    date placed
  }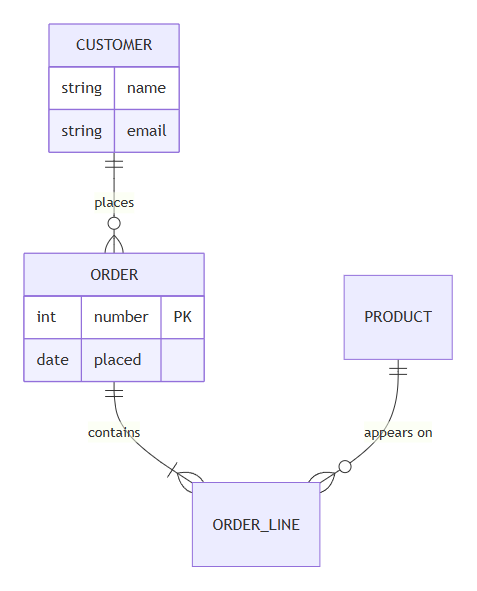
Reading the line ends
| End | Means |
|---|---|
|| | Exactly one |
o| | Zero or one |
}| | One or many |
}o | Zero or many |
Change it
- Fields go in braces after the table's name, one per line: a type, then a name.
-
PKafter a field marks the primary key: the field that tells each row apart.
Watch out
A label with a space needs double quotes, as in
: "appears on".
All options: every ERD option in the reference.
Show how statuses change
For a ticket's or a document's life cycle. A state diagram shows each status and what moves an item between them. Start with the State example.
stateDiagram-v2
  state "In progress" as InProgress
  state "Waiting for customer" as Waiting
  [*] --> Open
  Open --> InProgress : agent picks it up
  InProgress --> Waiting : question for the customer
  Waiting --> InProgress : customer replies
  InProgress --> Resolved : fix confirmed
  Resolved --> [*]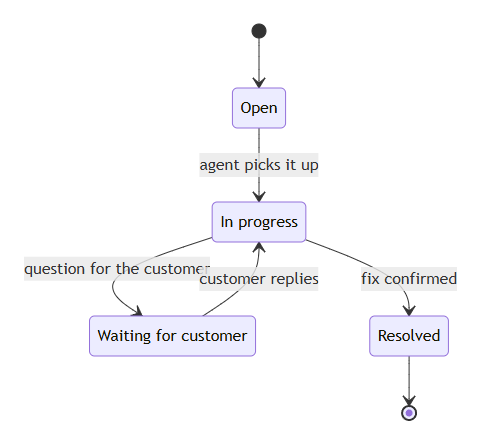
Change it
[*]is the start and the end.-
state "In progress" as InProgressgives a status a name with spaces. - The words after
:label the change.
Watch out
In the arrow lines, use the short name, such as
InProgress, not the name with spaces.
All options: every state diagram option in the reference.
Show shares of a whole
For a budget split, tickets by channel or time spent. A pie chart shows the parts of a whole. Start with the Pie example.
pie showData
  title Tickets by channel
  "Email" : 120
  "Portal" : 85
  "Chat" : 40
  "Phone" : 15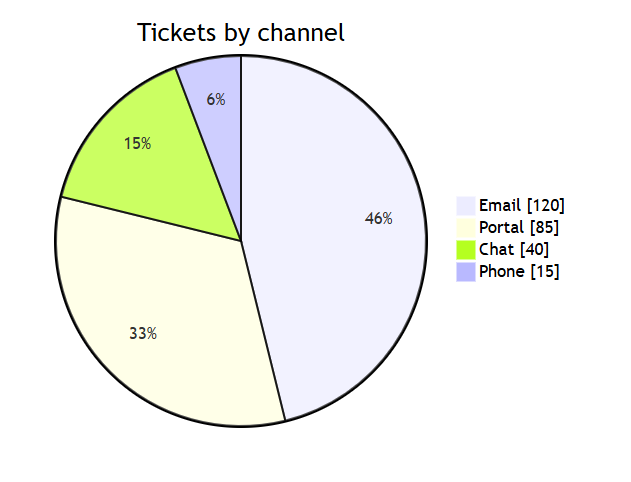
showData adds the numbers to the key.Change it
- Each slice is
"Label" : valueon a line of its own. -
showDataafterpieadds each value to the key, in square brackets.
Watch out
The values don't need to add up to 100. Each slice shows its share of the total.
All options: every pie chart option in the reference.
Map a customer journey
For each step a customer takes, and how it feels. It is not in
Examples, so type journey on the first
line.
journey
  title Getting help from support
  section Ask for help
    Find the help page: 3: Customer
    Raise a request: 4: Customer
  section Wait
    Get a first reply: 3: Customer, Agent
  section Resolved
    Problem solved: 5: Customer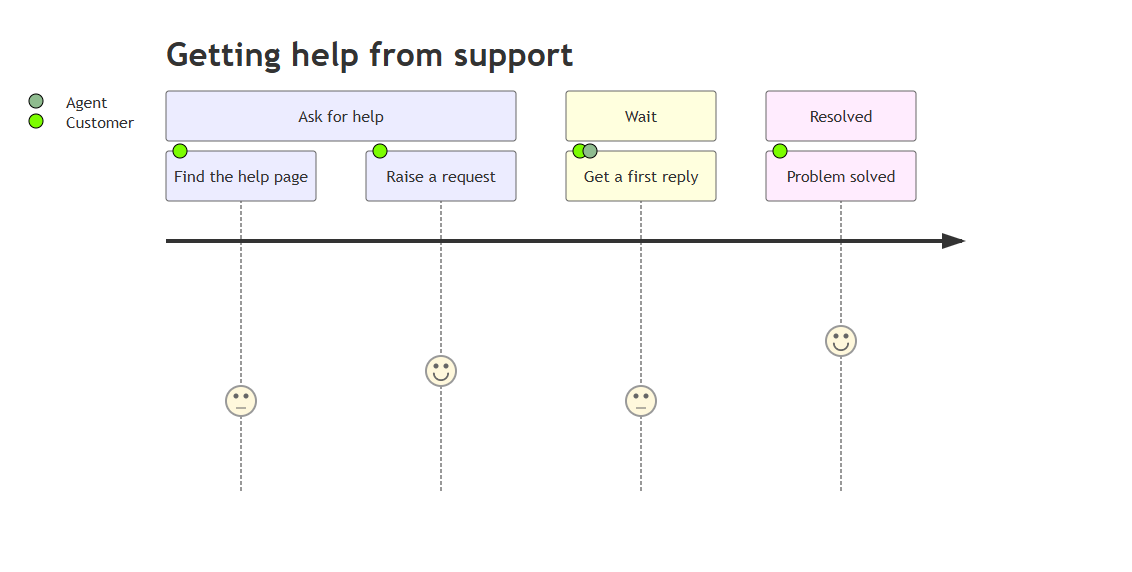
Change it
-
Each step is its name, a colon, a score from 1 to 5, a colon, and
who is involved:
Raise a request: 4: Customer. - List several people with commas:
Customer, Agent. sectiongroups the stages.
For this kind, the editor's Syntax reference shows the flowchart reference, so use this recipe as your guide. There is more on Mermaid's user journey page.
Show a timeline
For roadmaps and project history. Type timeline on the
first line.
timeline
  title Product roadmap 2027
  Q1 : Mobile app beta
  Q2 : Single sign-on : Reporting
  Q3 : Public API
  Q4 : Mobile app launch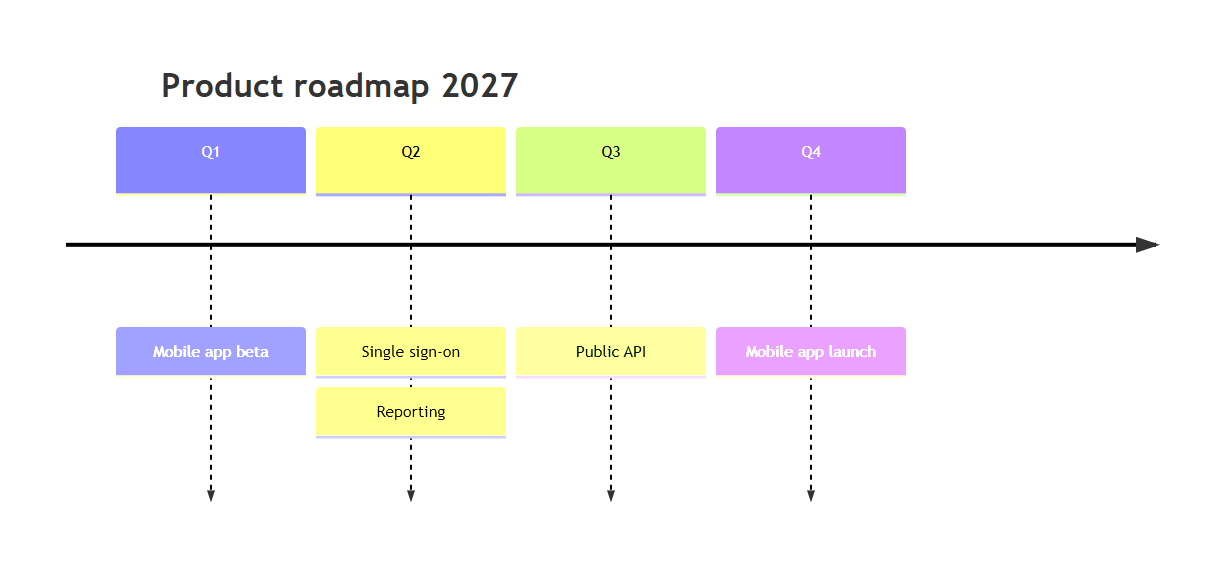
Change it
Each line is a period, a colon, then one or more events. Separate the events with colons.
For this kind, the editor's Syntax reference shows the flowchart reference, so use this recipe as your guide. There is more on Mermaid's timeline page.
Other kinds of diagram
Class diagrams have their own Class example; see the class diagram reference. Quadrant charts, git graphs and other kinds Mermaid supports also work.
Their syntax is on mermaid.js.org. For a first draft, use Draft with AI in the editor.
Keep a big diagram readable
Confluence pages are narrow, so a big diagram gets small. These habits help:
-
Use
flowchart TDfor a long process, so the diagram grows down, not across. -
Keep labels to two to five words. Use
<br>for a second line. - Group steps with
subgraph. - Split one huge diagram into several smaller ones.
-
Leave a note for the next person who edits it, on a line of its own
that starts with
%%.
Readers can zoom, fit and go full screen; see Zoom, copy and download. A diagram taller than about 22 inches in Word, or too large to draw, gets no picture for Word and PDF. So split a very long process. See Export the page to PDF or Word.
Still stuck?
Raise a request in our support portal, or email [email protected]. First reply in 1-3 business days, depending on severity (see our service level agreement).
These help us answer faster:
- The diagram's text (select Copy in its toolbar)
- What you expected, and what happened instead
- A screenshot, if it is a visual problem