Gantt charts in Confluence Cloud, with Mermaid
Mermaid's gantt diagram is a project plan written as
plain text: tasks, dates, dependencies and status, drawn as bars on a
calendar. This guide covers the syntax and, honestly, where it holds
up and where it doesn't once you export or reshuffle the plan.
Confluence Cloud doesn't render Mermaid on its own, so the
ways to get the chart onto a page are near
the end.
A Gantt chart in a few lines
gantt
  title Office move
  dateFormat YYYY-MM-DD
  axisFormat %d %b
  excludes weekends
  section Prepare
    Choose movers       :done, movers, 2026-10-01, 3d
    Pack team areas     :active, pack, after movers, 5d
  section Move
    Move furniture      :crit, move, after pack, 2d
    Set up desks and IT :it, after move, 3d
    Office opens        :milestone, open, after it, 0d
  section Afterwards
    Collect feedback    :feedback, after open, 5d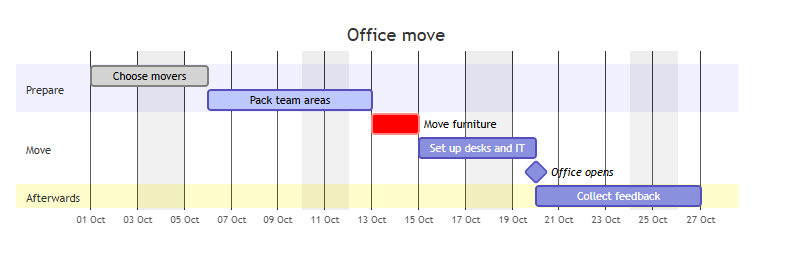
dateFormat says how the dates are written, and
axisFormat %d %b writes the dates along the bottom as 05 Oct.
excludes weekends skips Saturdays and Sundays when it works
out how long each task runs.
Each task line is a name, a colon, then details separated by commas: a
short id, a start and a length, such as 3d for three days
or 2w for two weeks. A lowercase m means
minutes; months are a capital M. section
and a name start a group of tasks, and the name shows down the left
of the chart.
What the tags do
-
doneandactivemark a task finished or in progress. They change how the bar is drawn, not the dates. -
critmarks it critical. Tags can be combined, as incrit, active. -
milestone, with a length of0d, draws a diamond instead of a bar. Use it for a single point in time, such as a launch day. -
afterand an id, in place of a start date, starts a task when the one it names ends.after move it, with two ids, starts it when the later of the two ends.
Use after, not fixed dates
The tempting shortcut is to write every task's calendar date by hand.
Don't: the moment one task runs long, every date after it is wrong
until you fix each one yourself. Write dependencies with
after instead, and moving one task moves everything that
depends on it.
gantt
  title Campaign page
  dateFormat YYYY-MM-DD
  axisFormat %d %b
  tickInterval 1day
  section Content
    Write copy    :copy, 2026-11-02, 4d
    Design banner :banner, 2026-11-02, 6d
  section Publish
    Publish page  :publish, after copy banner, 1d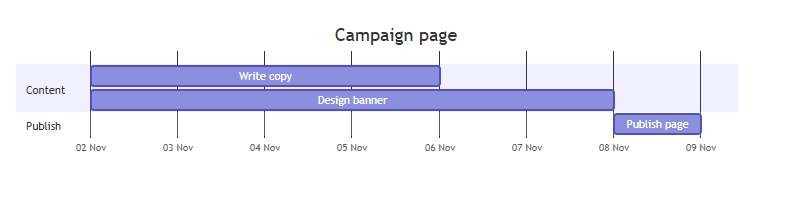
Publish page waits for whichever of the two Content tasks finishes later: Design banner, the longer one. Stretch Design banner from 6 to 8 days, and Publish page moves with it, from 8 to 10 November, with no other line touched.
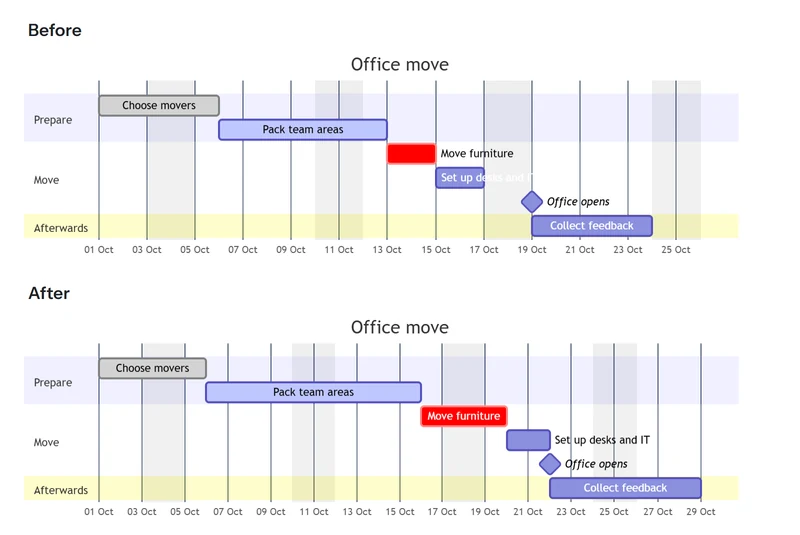
Holidays and the today line
excludes weekends skips Saturdays and Sundays. Add dates
after it, separated by commas, to skip holidays too. A task that spans
them takes longer in calendar time.
gantt
  title December support rota
  dateFormat YYYY-MM-DD
  axisFormat %d %b
  excludes weekends, 2026-12-24, 2026-12-25, 2026-12-31
  todayMarker off
  section Cover
    Team A :teama, 2026-12-14, 5d
    Team B :teamb, after teama, 5d
    Team A :teama2, after teamb, 5d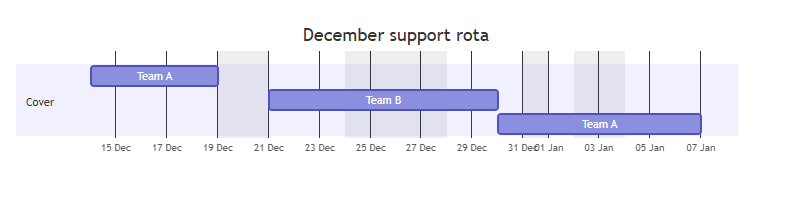
A line marks today when today falls within the chart.
todayMarker off hides it, as above, and
todayMarker stroke-width:3px,stroke:#1f9e7d restyles it
instead. If your weekend is Friday and Saturday, add
weekend friday under excludes weekends.
Where a Mermaid Gantt chart breaks down
A plain-text Gantt chart has limits, and it is worth knowing them before you build a 40-task project plan around one:
-
A colon ends a task's name, so don't put one inside
a name. Mermaid cuts the name short there, with no error, and the
rest ends up in the details, where it changes the task's id. A
task that comes
afterit then no longer finds it, and starts today instead. Keep#and;out of the details after the colon too: either one causes an error. -
Give every task its own id. If two tasks share
one, an
afterthat names it follows the later of them, with no error. -
Write every date the way
dateFormatsays. A date written another way can be read as a different day, again with no error: withdateFormat YYYY-MM-DD,01/10/2026came out as 10 January. - A big plan gets cramped, not wider. Mermaid draws a Gantt chart as wide as the space it has, and each task adds a row. So a plan over many months squeezes more days into the same width: bars get thin and the dates along the bottom crowd together. A plan with many tasks grows taller.
-
There is no single fix for that in the syntax.
axisFormatandtickInterval(1week,1month) keep the dates along the bottom readable. For a long plan, a few shorter diagrams, one per phase and each grouped intosections, usually read better than one diagram covering a whole year.
The crowding comes from how Mermaid itself draws a Gantt chart. A reader can still enlarge a crowded chart: in our app, zoom in from its toolbar, or double-click it to open it full screen, as large as the screen allows.
Getting it onto a page, and what happens after
The ways are the same as for any Mermaid diagram in Confluence: a static picture, the viewer macro that Atlassian Labs publishes, free on 10 November 2026, reading an ordinary code block, or a Mermaid macro app. How to add Mermaid diagrams to a Confluence Cloud page covers all three.
We make one of those apps, Mermaid Diagrams & Gantt for Confluence, so what follows describes ours, at version 2.9.0. For a Gantt chart, three questions matter more than they do for a flowchart, because a project plan usually outlives the page it was written on. Ask them of any app you consider.
Does it survive a Word or PDF export?
In our app, saving the diagram also saves a picture of it, and Word and PDF exports use that picture, without the toolbar. So the file shows the chart as you saved it. A chart set to Auto colours comes out in light colours, unless its own text sets a theme; then it comes out on a background it can be read on.
There is a limit: a diagram taller than about 22 inches in Word, or too large to draw, gets no picture. The editor says so when you select Save and offers Save without picture, rather than failing silently. That diagram then reaches Word as its Mermaid text, and PDF draws it live, until it is saved again smaller. Each task adds one row, so only a long plan gets near it.
Does it survive dark mode?
In our app, Colours starts on Auto, which draws the chart in light colours on a light page and dark ones on a dark page. If the chart's own text sets a theme or colours that don't match the page, it sits on its own panel so its bars and labels stay readable. Word and PDF exports use light colours for Auto, unless the chart's own text sets a theme.
Does it survive a lapsed licence?
In our app, from version 2.8, yes. If the site's licence is not active, the chart keeps showing on its page as it was last saved, and keeps exporting. Only editing stops: the editor opens, says that editing needs an active licence, and does not save. Before 2.8, the page showed a licence message in place of the chart.
Test the first two on a real, multi-section plan before you commit a team's project tracking to any one app. The four checks on the comparison page (PDF export, Word export, dark mode, pasting one in from elsewhere) apply to a Gantt chart too.
Questions
Can a Mermaid Gantt chart show task dependencies?
Yes. Write after and an id, or two ids, in place of a start date, and the task starts when the task it names ends. Change one task's length, and everything that depends on it moves with it.
Can it skip weekends and holidays?
Yes. excludes weekends skips Saturdays and Sundays; add dates after it, separated by commas, to skip holidays too.
Does it support milestones?
Yes. A task tagged milestone with a length of 0d is drawn as a diamond, for a single point in time such as a launch date.
Is there a limit on how many tasks or how long a plan can be?
Not a hard one in the syntax. But the chart is drawn as wide as the space it has, so a plan over many months gets cramped, and each task adds a row. Group tasks into sections, and consider two or three shorter diagrams before you have fifty tasks on one chart.
Does it export cleanly to Word or PDF?
In our app, yes, with one limit: a diagram taller than about 22 inches in Word, or too large to draw, gets no picture, and the editor offers a choice when you save rather than leaving a silent gap.
What happens to the chart if the app's licence ends?
In our app, from version 2.8, the chart keeps showing on its page as it was last saved and keeps exporting. Only editing stops until the licence is active again. A static picture and the free viewer macro need no licence.
I just need the full syntax, not a tutorial.
Mermaid's own Gantt reference has it all. Our Gantt recipes have examples to copy and change, and our reference lists every Gantt option in the Mermaid the app includes.
Related pages
- How to add Mermaid diagrams to a Confluence Cloud page: three ways to get any Mermaid diagram onto a page.
- Mermaid diagrams in Confluence Cloud: how the options compare: the options side by side, where our app fits and where it stops.
- Gantt recipes: plans to copy and change.
- Export the page to PDF or Word: what our app does in each export.
- All guides.
Sources and changes
Every example and every statement about the syntax on this page was run on 10 November 2026 through Mermaid 11.16.1, and again on 12 November 2026 through Mermaid 12.3.0, the version our app includes since 2.9.0, each set up as the app sets it up. The two runs gave the same results. The four pictures of charts were drawn earlier by the app; both runs gave the same dates. What the page says about our own app describes version 2.9.0, released on 12 November 2026, and comes from its documentation and code. The viewer macro's price was read from its Marketplace listing on 10 November 2026.
- Gantt diagrams, Mermaid documentation: the tags,
after,excludes,weekend,todayMarker,tickInterval(10 Nov 2026) - Mermaid diagrams viewer, by Atlassian Labs: its Marketplace listing (10 Nov 2026)
- Mermaid Diagrams & Gantt for Confluence (ours): its Marketplace listing, and its reference (10 Nov 2026)
Changelog
- . Updated for version 2.9.0 of our app, which draws with Mermaid 12.3.0. Every example and every statement about the syntax was run again through it, with the same results.
- . First version, describing Mermaid 11.16.1 and Mermaid Diagrams & Gantt for Confluence 2.8.0.
Corrections
None yet. If something here is wrong or out of date, email [email protected].