The OpenAPI map on the page
What an OpenAPI diagram shows on a published page, how it follows light and dark mode, and what Word and PDF exports show.
What readers see
On the page, the description becomes a map:
- the API's title and version, the OpenAPI or Swagger version, and its first server address, as plain text;
- every endpoint, grouped by its tags in the order the description lists them: the method, the path and its summary. Endpoints with no tag are listed last, under Other endpoints. An endpoint with two tags is listed under each, so the map can have more rows than the API has endpoints;
- a deprecated endpoint is struck through, and its summary starts with "Deprecated:";
-
every schema as a box, with up to 10 of its properties and their
types, and "+3 more" (or however many) for the rest. A required
property has a
*after its name.
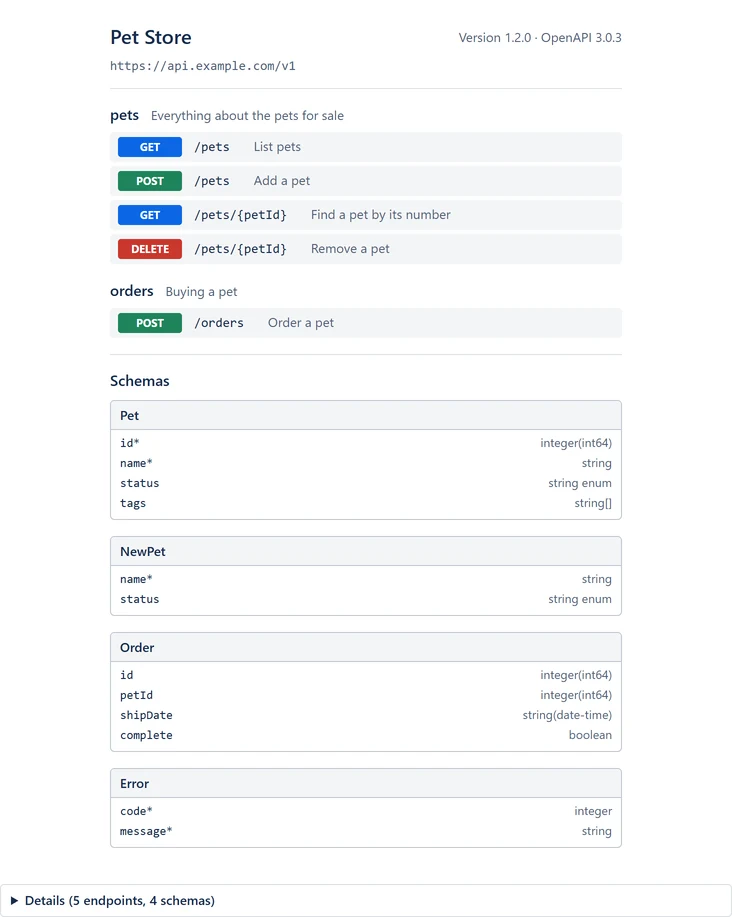
Under the map, Details opens to list each endpoint and each schema in full. Open an endpoint to see its parameters, its request body, its responses and their examples. Open a schema to see all its properties, nested ones included.
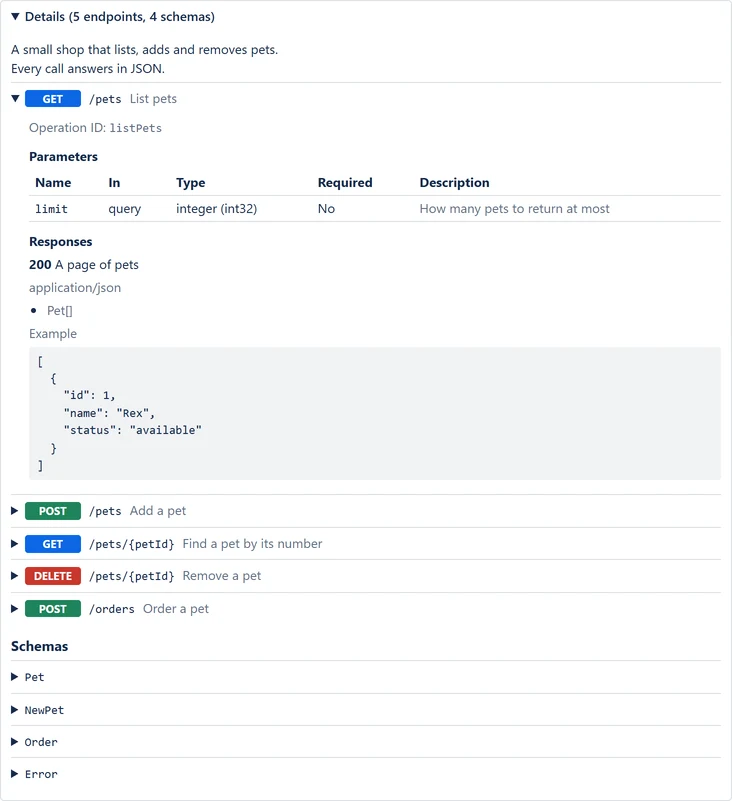
A large API gets a map of its first 150 endpoints and 40 schemas, which ends with a line such as "…and 60 more endpoints, listed under Details." Details lists all of them.
The map has the same toolbar as the app's other diagrams: zoom, Fit, full screen, copy the description, and the map as an image, an SVG or a PNG. See Zoom, copy and download.
Colours and dark mode
Colours, at the top of the editor, works as it does for PlantUML:
- Auto (match Confluence), the default, draws the map light or dark to match each reader's Confluence.
- Light or Dark keeps the map that way for every reader. Where the page is the other way, the map sits on a panel of its own.
The method colors (GET blue, POST green, PUT orange, PATCH purple, DELETE red) are the same in both. Each method is also written out on its label, so the colors are never the only cue.
Export to Word and PDF
When you save, the app also saves a picture of the map. Word and PDF exports, and page history, show that picture.
- A picture has a height limit. For a large API, the picture shows the endpoints and schemas that fit, and ends with a line such as "…and 60 more endpoints, listed under Details on the page."
- Email notifications show the description as text, in a code block, never the picture.
- If the picture cannot be made, the editor does not save at once. It says "Not saved yet: no picture for Word and PDF." Select Save without picture to go ahead. Word exports and page history then show the description as text, and PDF exports draw the map as they export, which is slower.
See Export the page to PDF or Word for exports in general.